Mitigation Toolkit
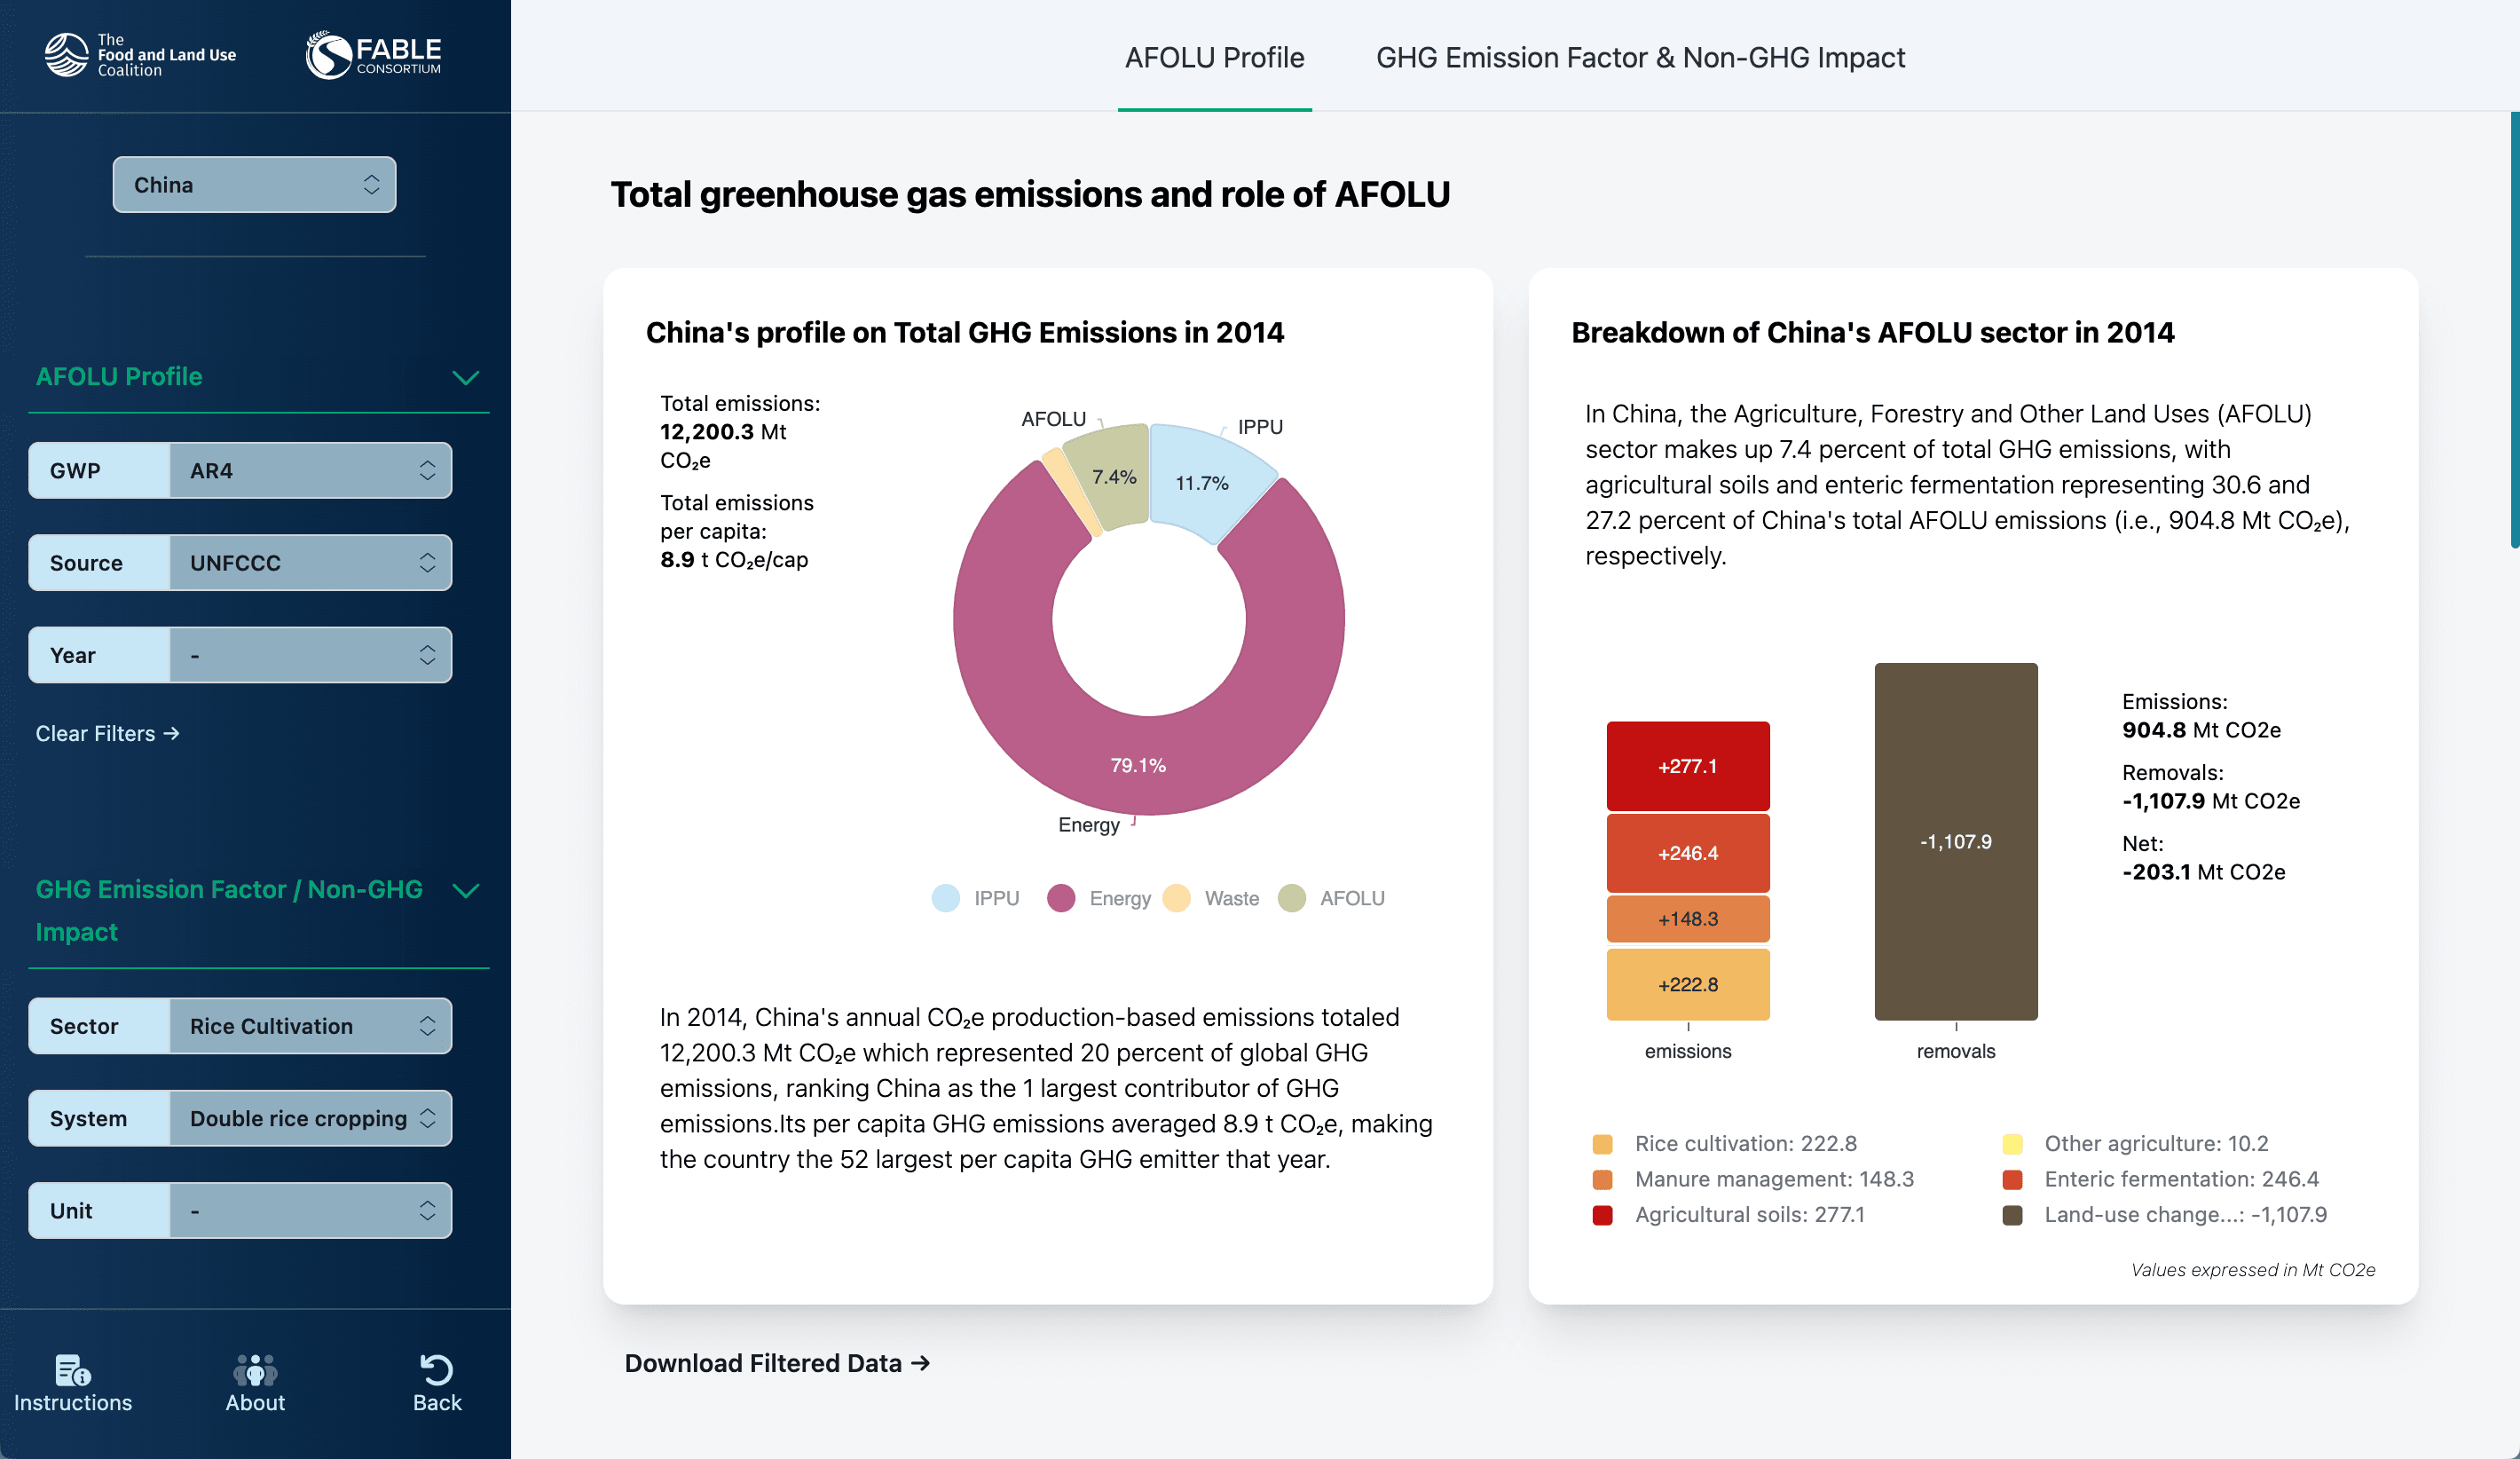
A data visualization on greenhouse gas (GHG) mitigation options for agriculture and land use in different countries. Tip: Select China for all functionalities
A selection of all my projects
Frameworks
React, Next.js
Languages
JavaScript, Python, Bash, Node.js, HTML, CSS
Databases
MongoDB
Libraries
D3.js, Framer Motion, Redux, Recoil, MobX, ...
CSS Libraries
TailwindCSS, styled-components
Other
JEST, Cypress, Tableau, Alteryx
A data visualization on greenhouse gas (GHG) mitigation options for agriculture and land use in different countries. Tip: Select China for all functionalities

A way to test full datasets with JEST (e.g., 3 seconds for 3,500 tests)
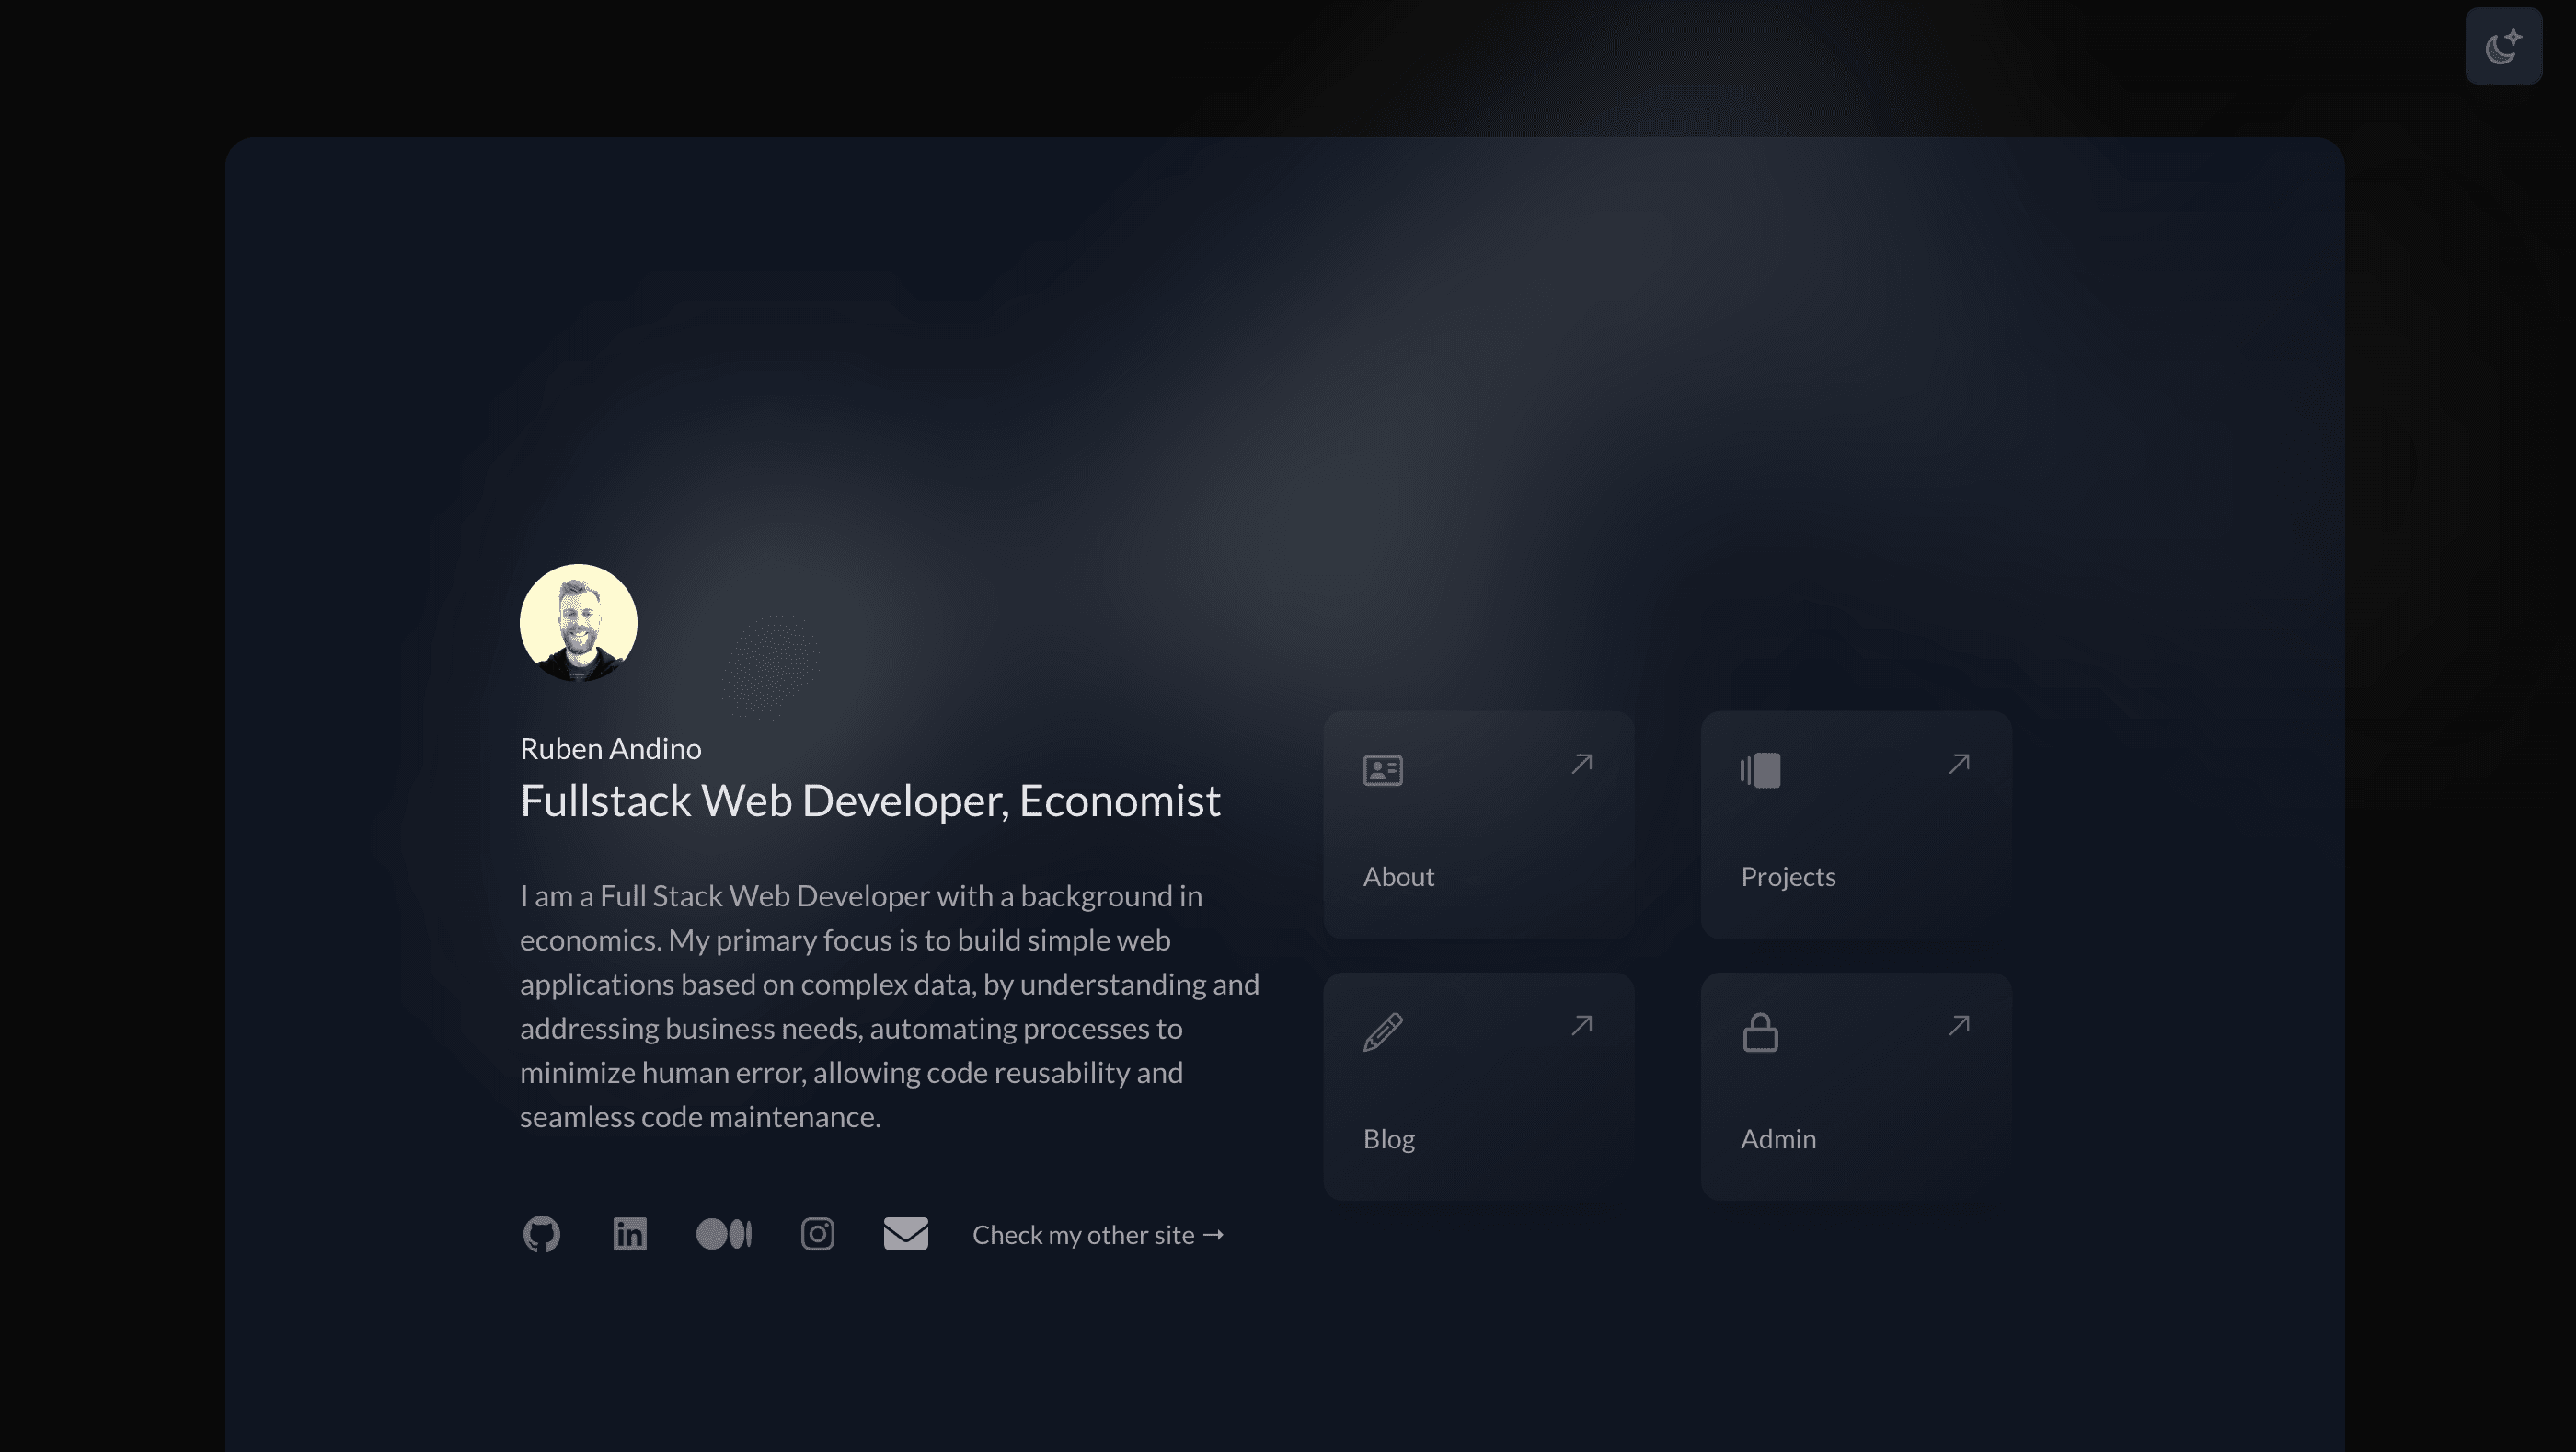
A portal to showcase my work, host my own blog posts, including translation and CMS capabilities
Custom hook to create pagination for any list of items
Custom hook to detect the current breakpoint allowing to render different components based on the screen size
Custom hook to animate values with Framer Motion, allowing to animate numbers
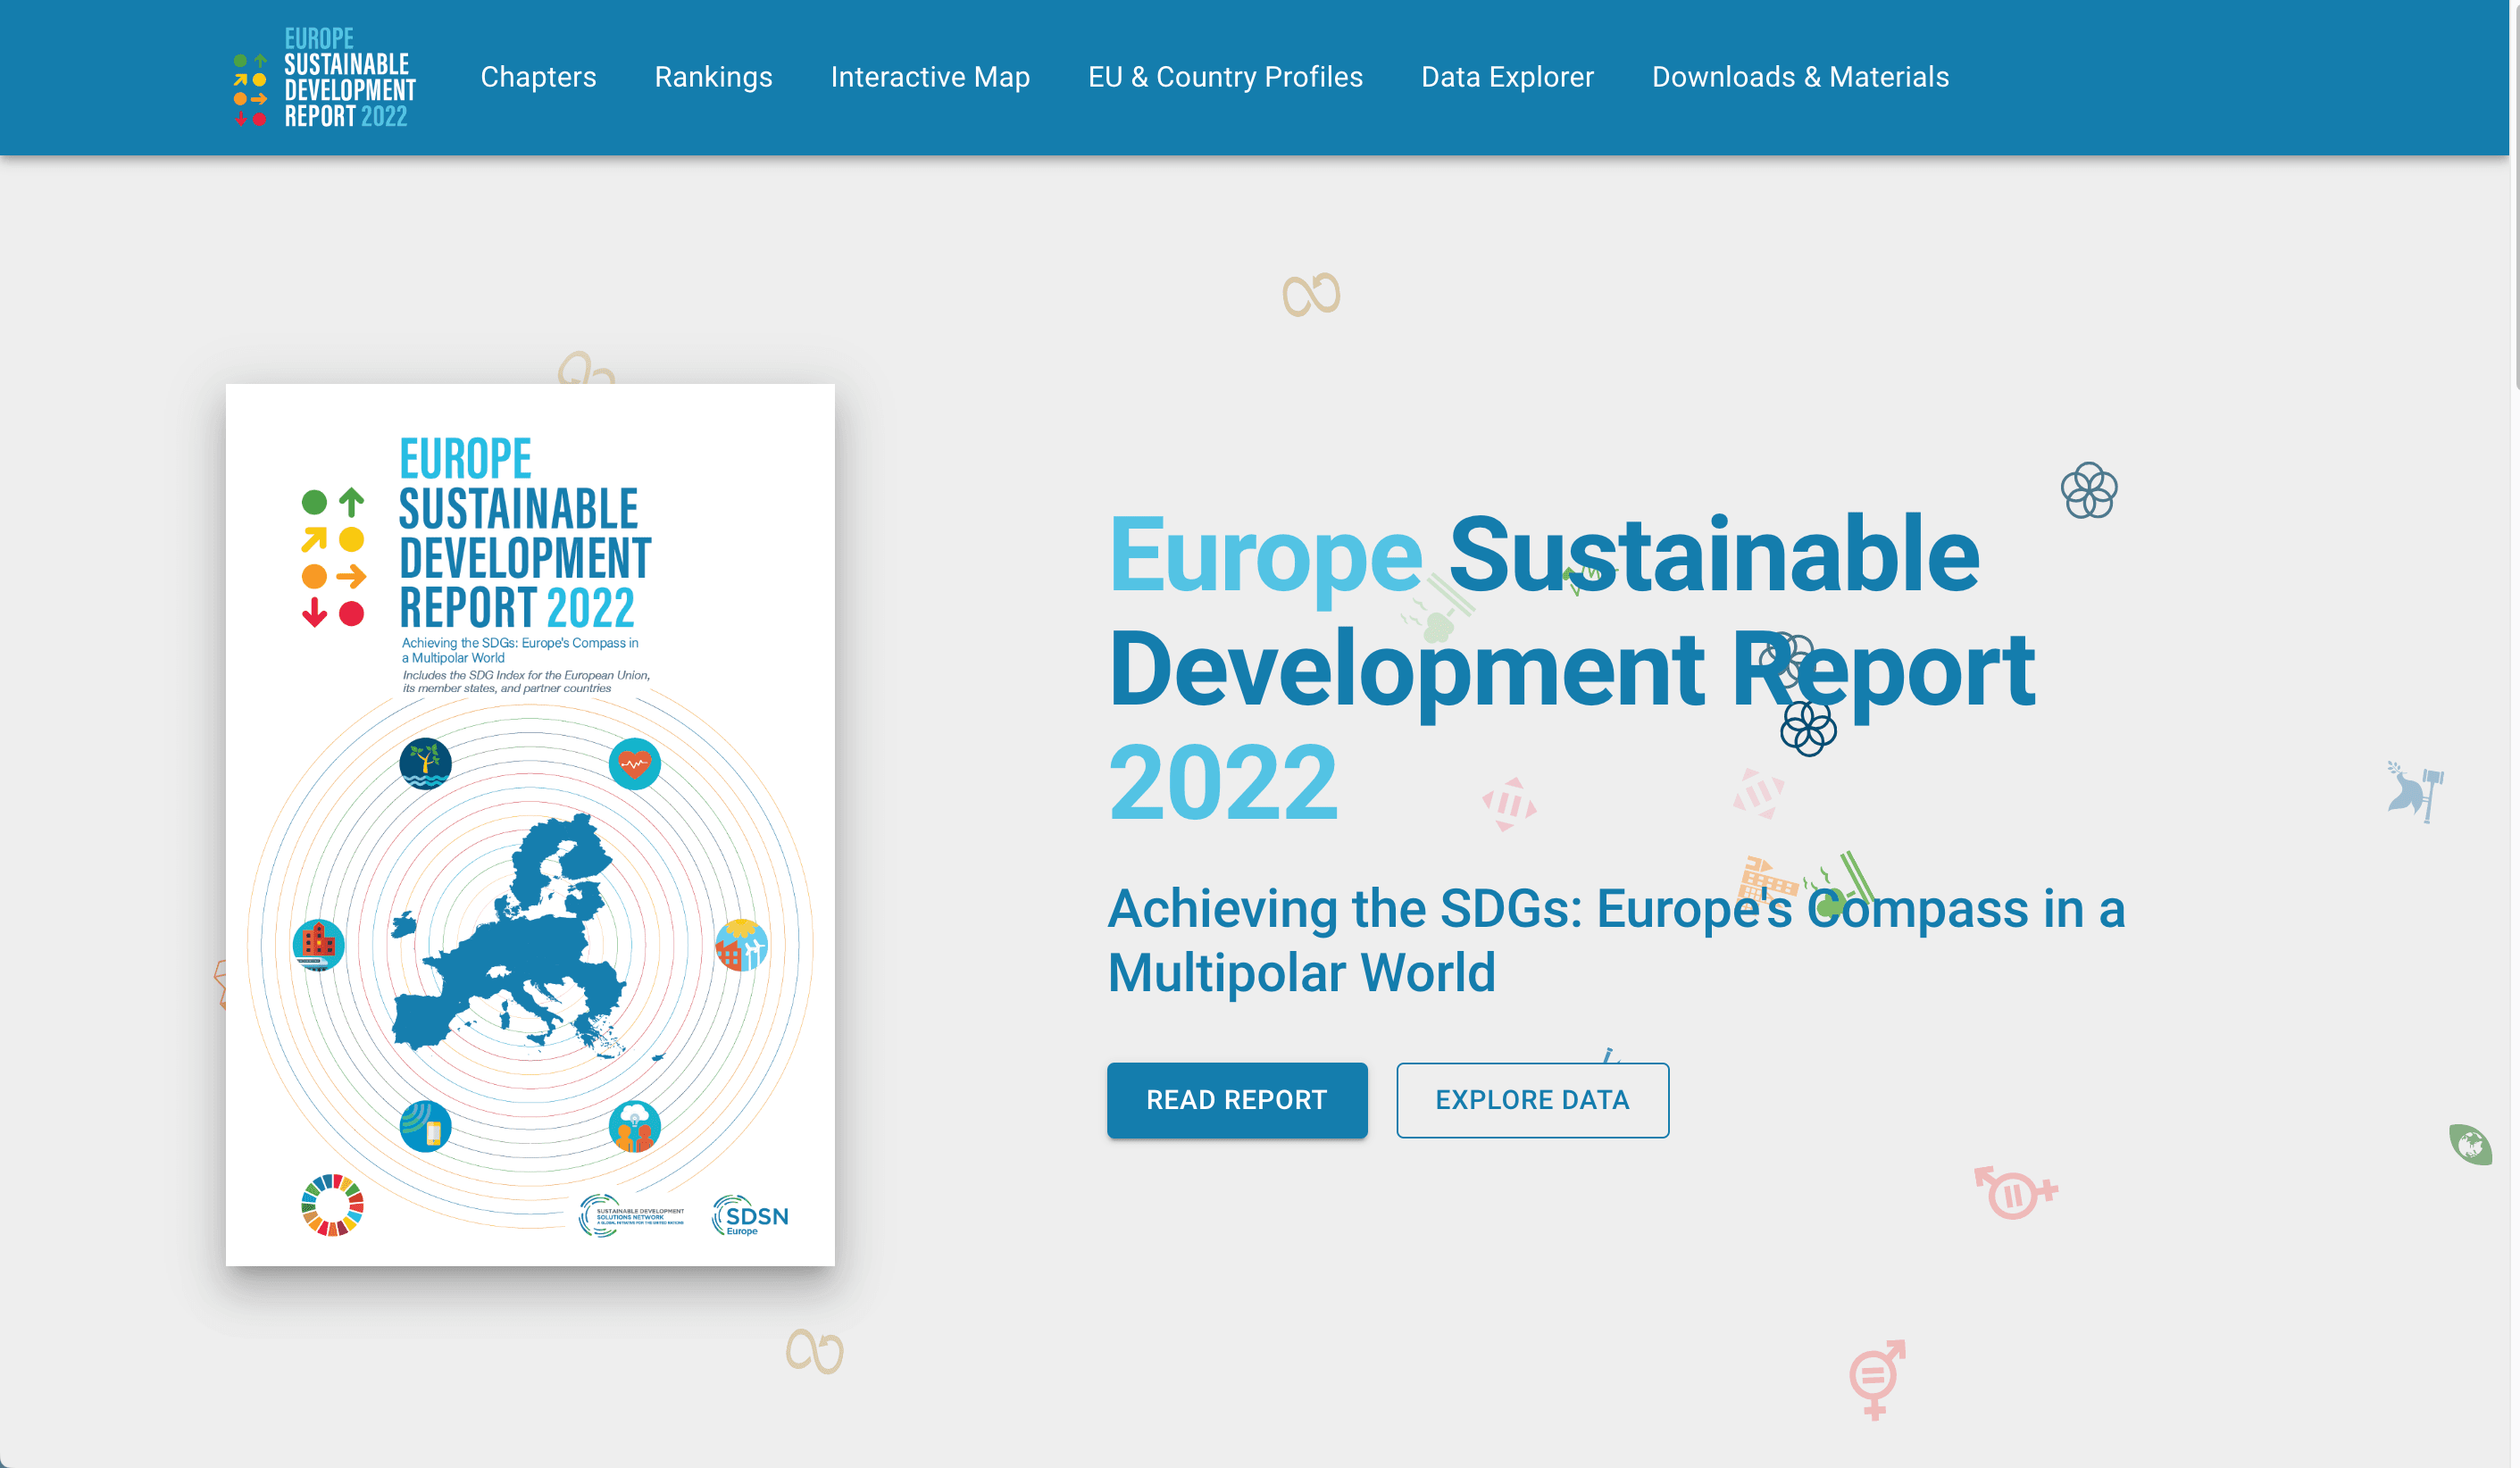
This is a data visualization to showcase the performance of European countries towards the UN sustainable development goals.
Website dedicated to web development services, so that potential clients can get in contact with rawDev

Automation of image optimization with AVIF, png and WebP formats, so that images are optimized for the web
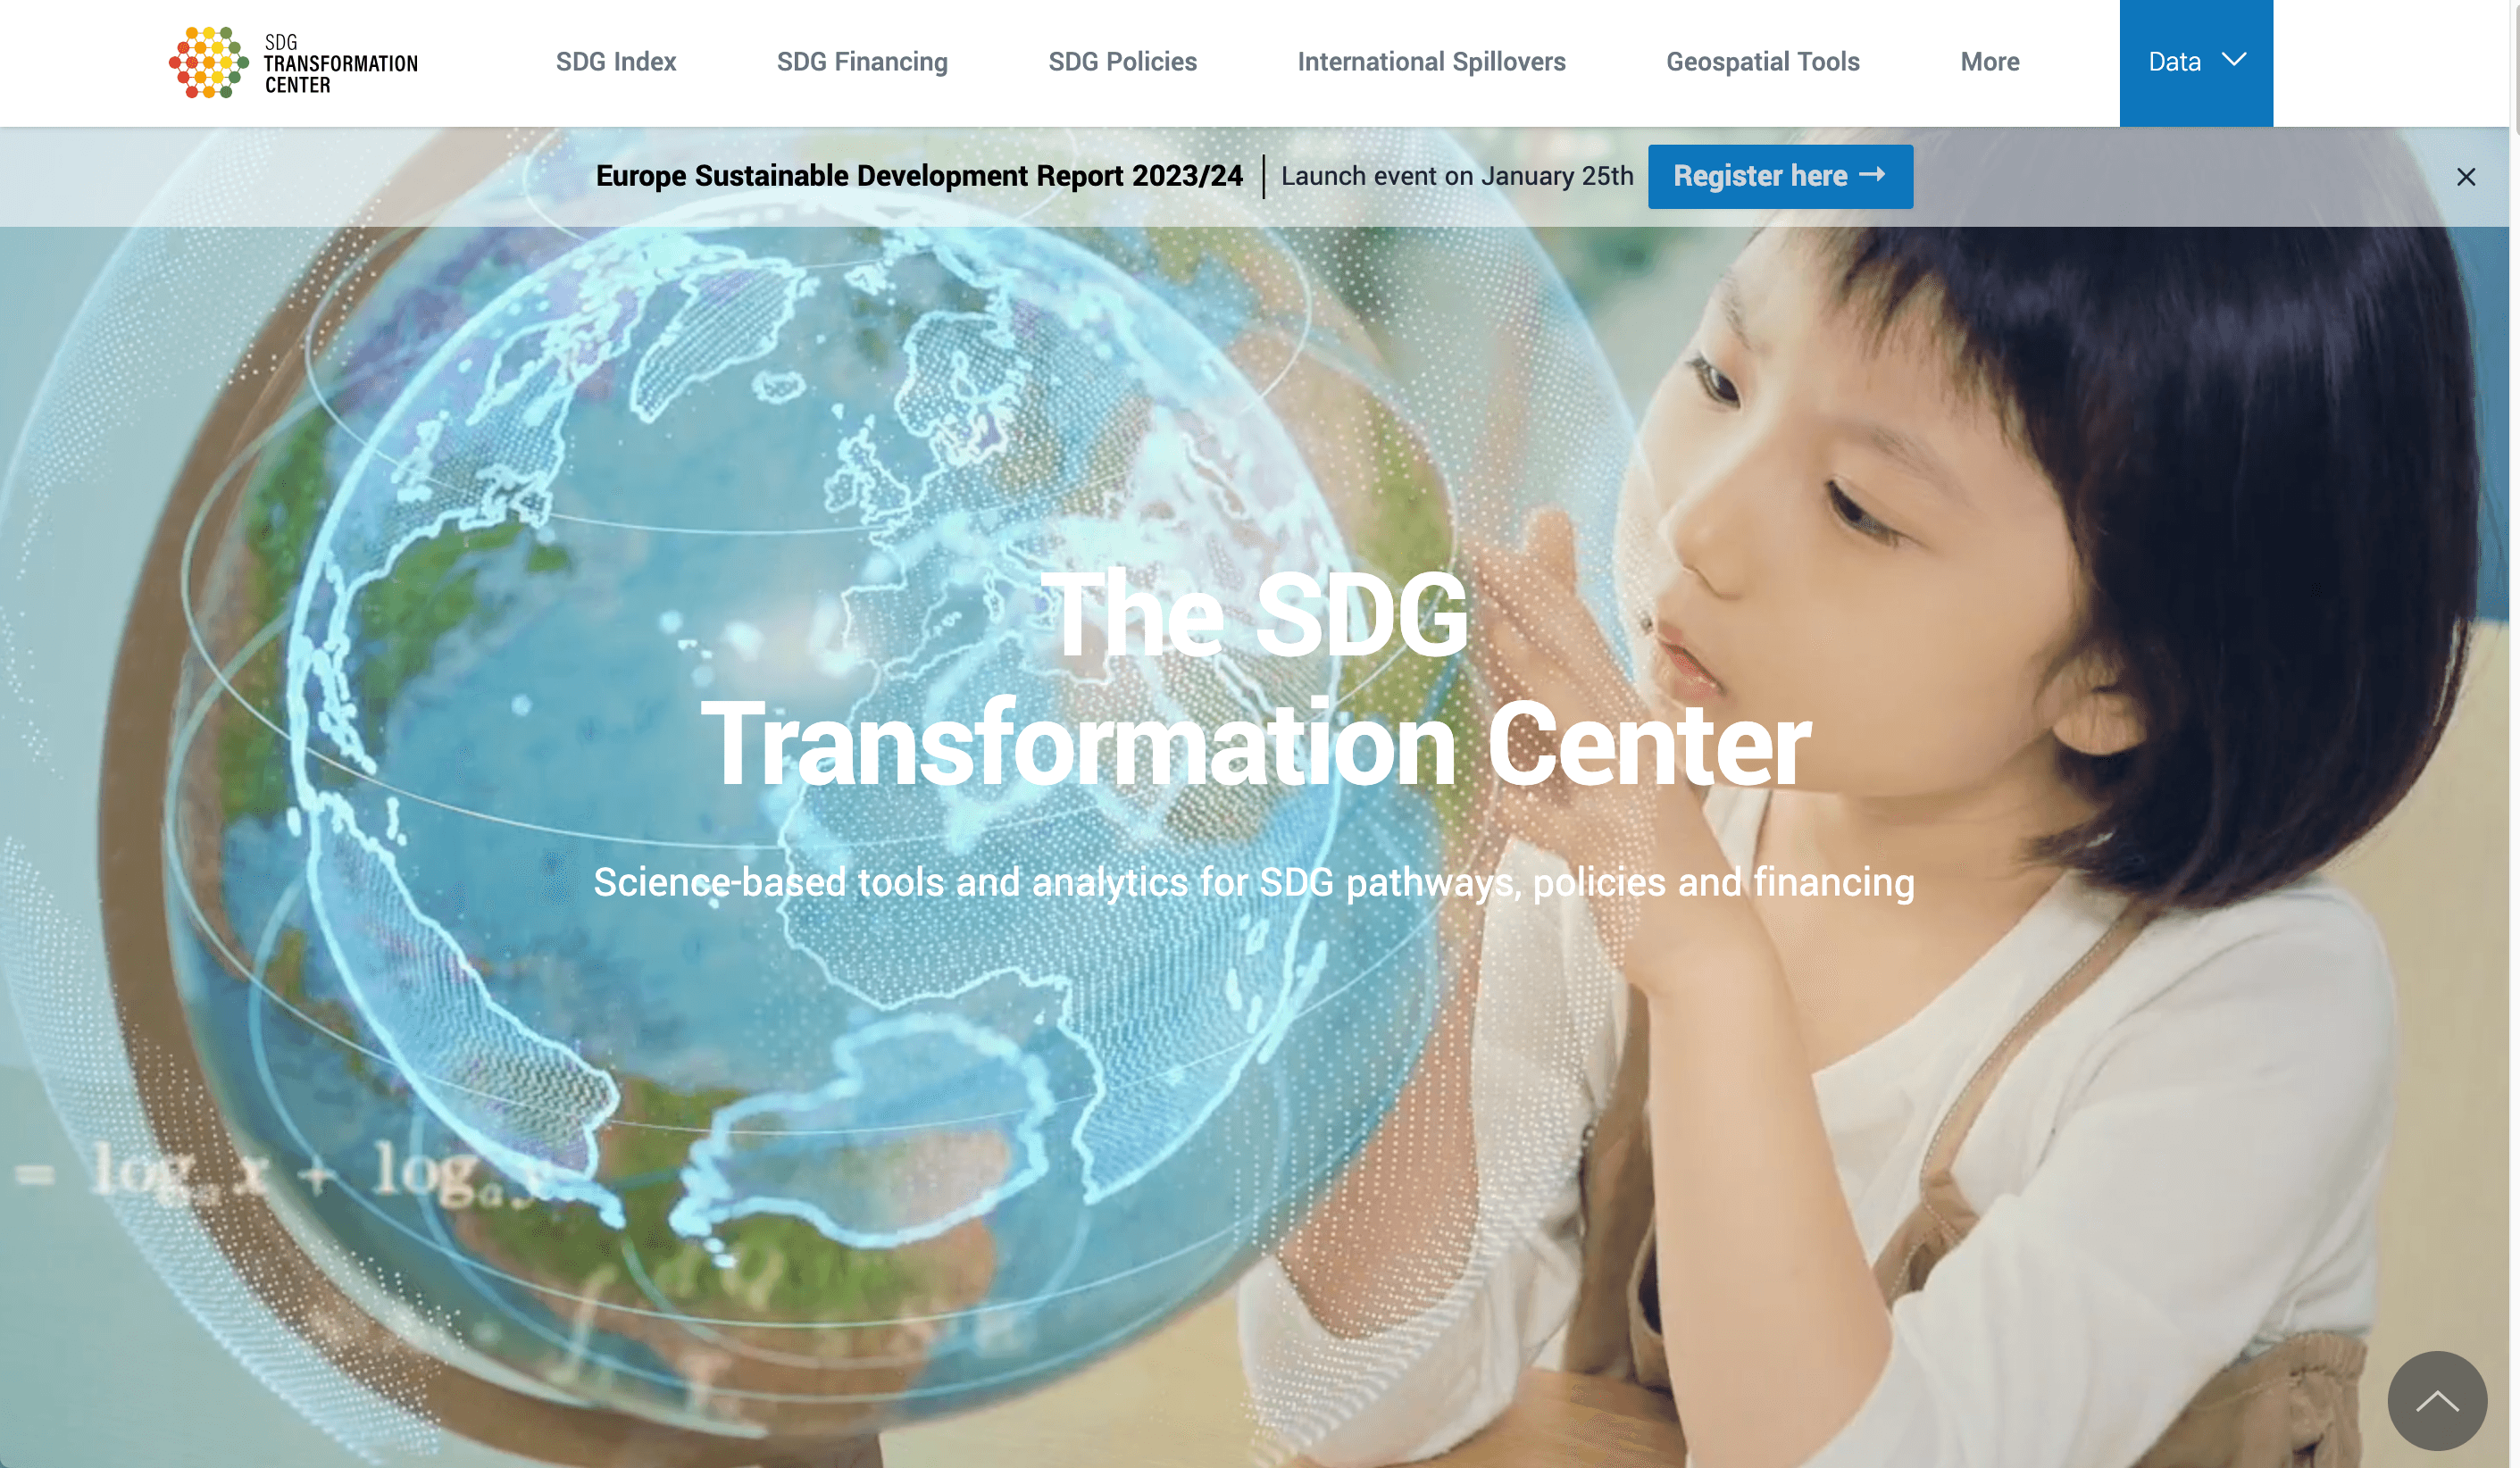
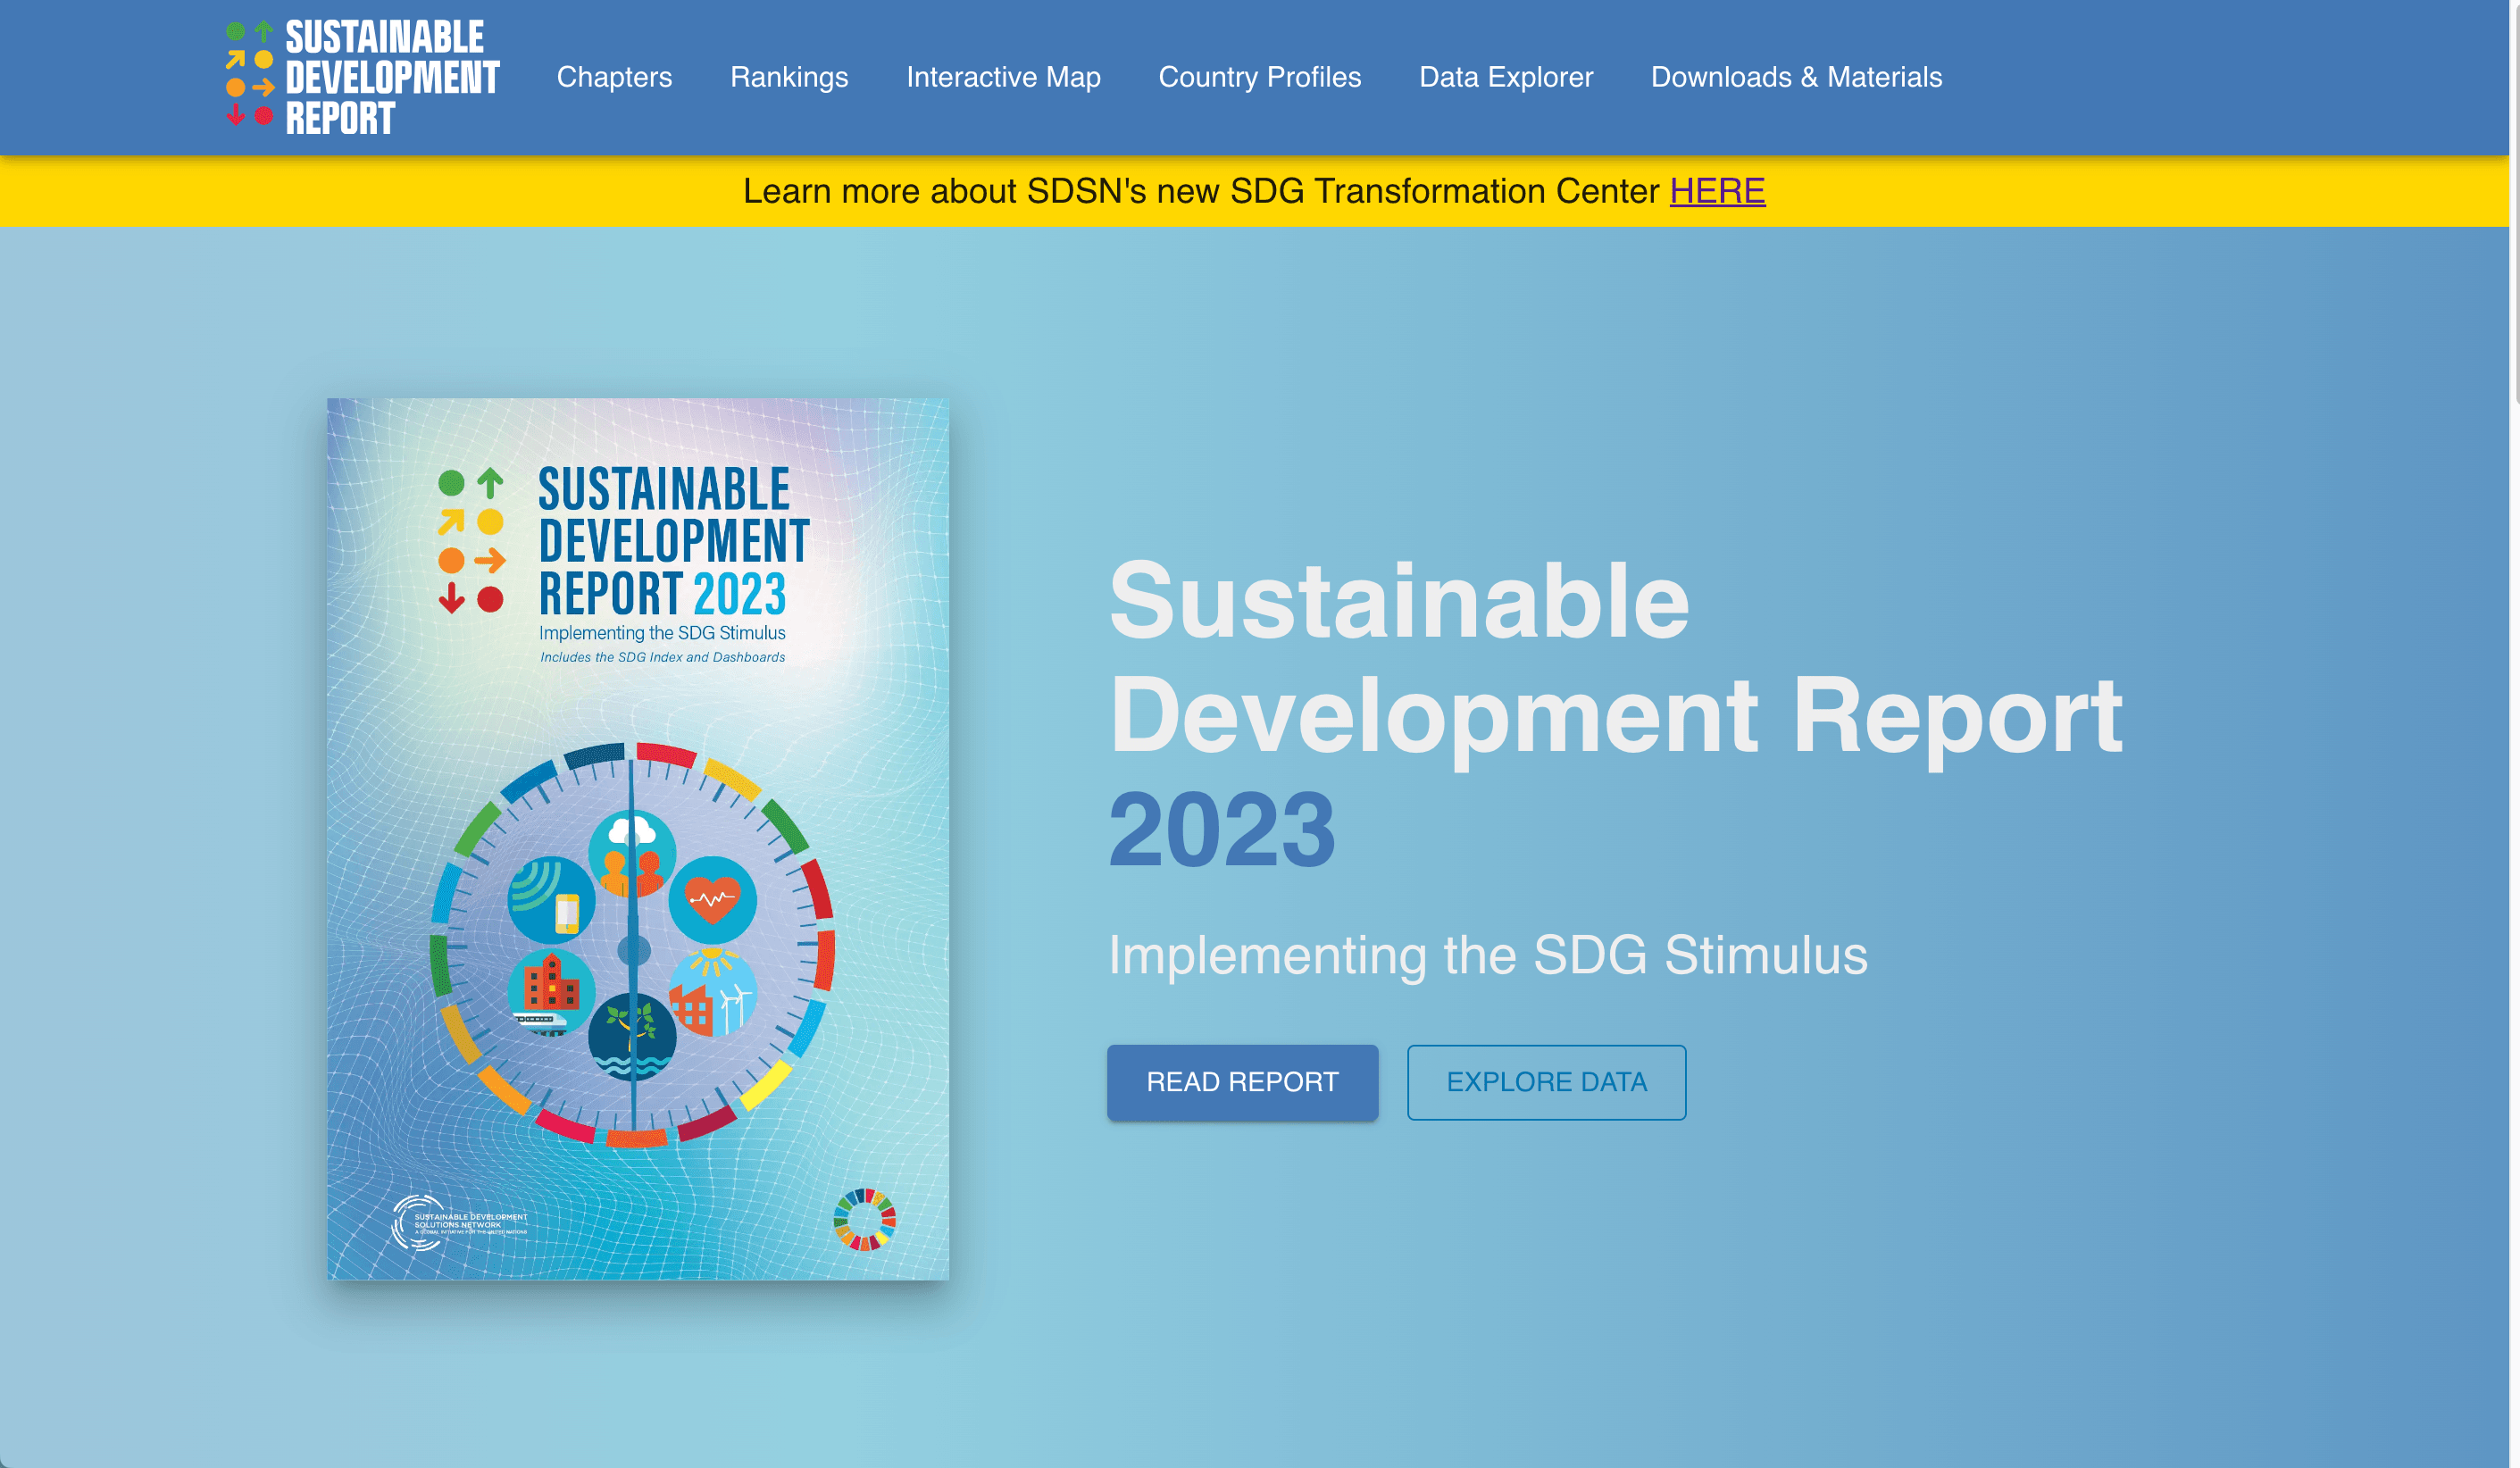
Static website which includes an online library for the SDG Transformation Center, so that people can get access to publications and other resources
This is a data visualization to showcase the performance of UN members towards the UN sustainable development goals.
A heatmap to visualize specific data points in a matrix
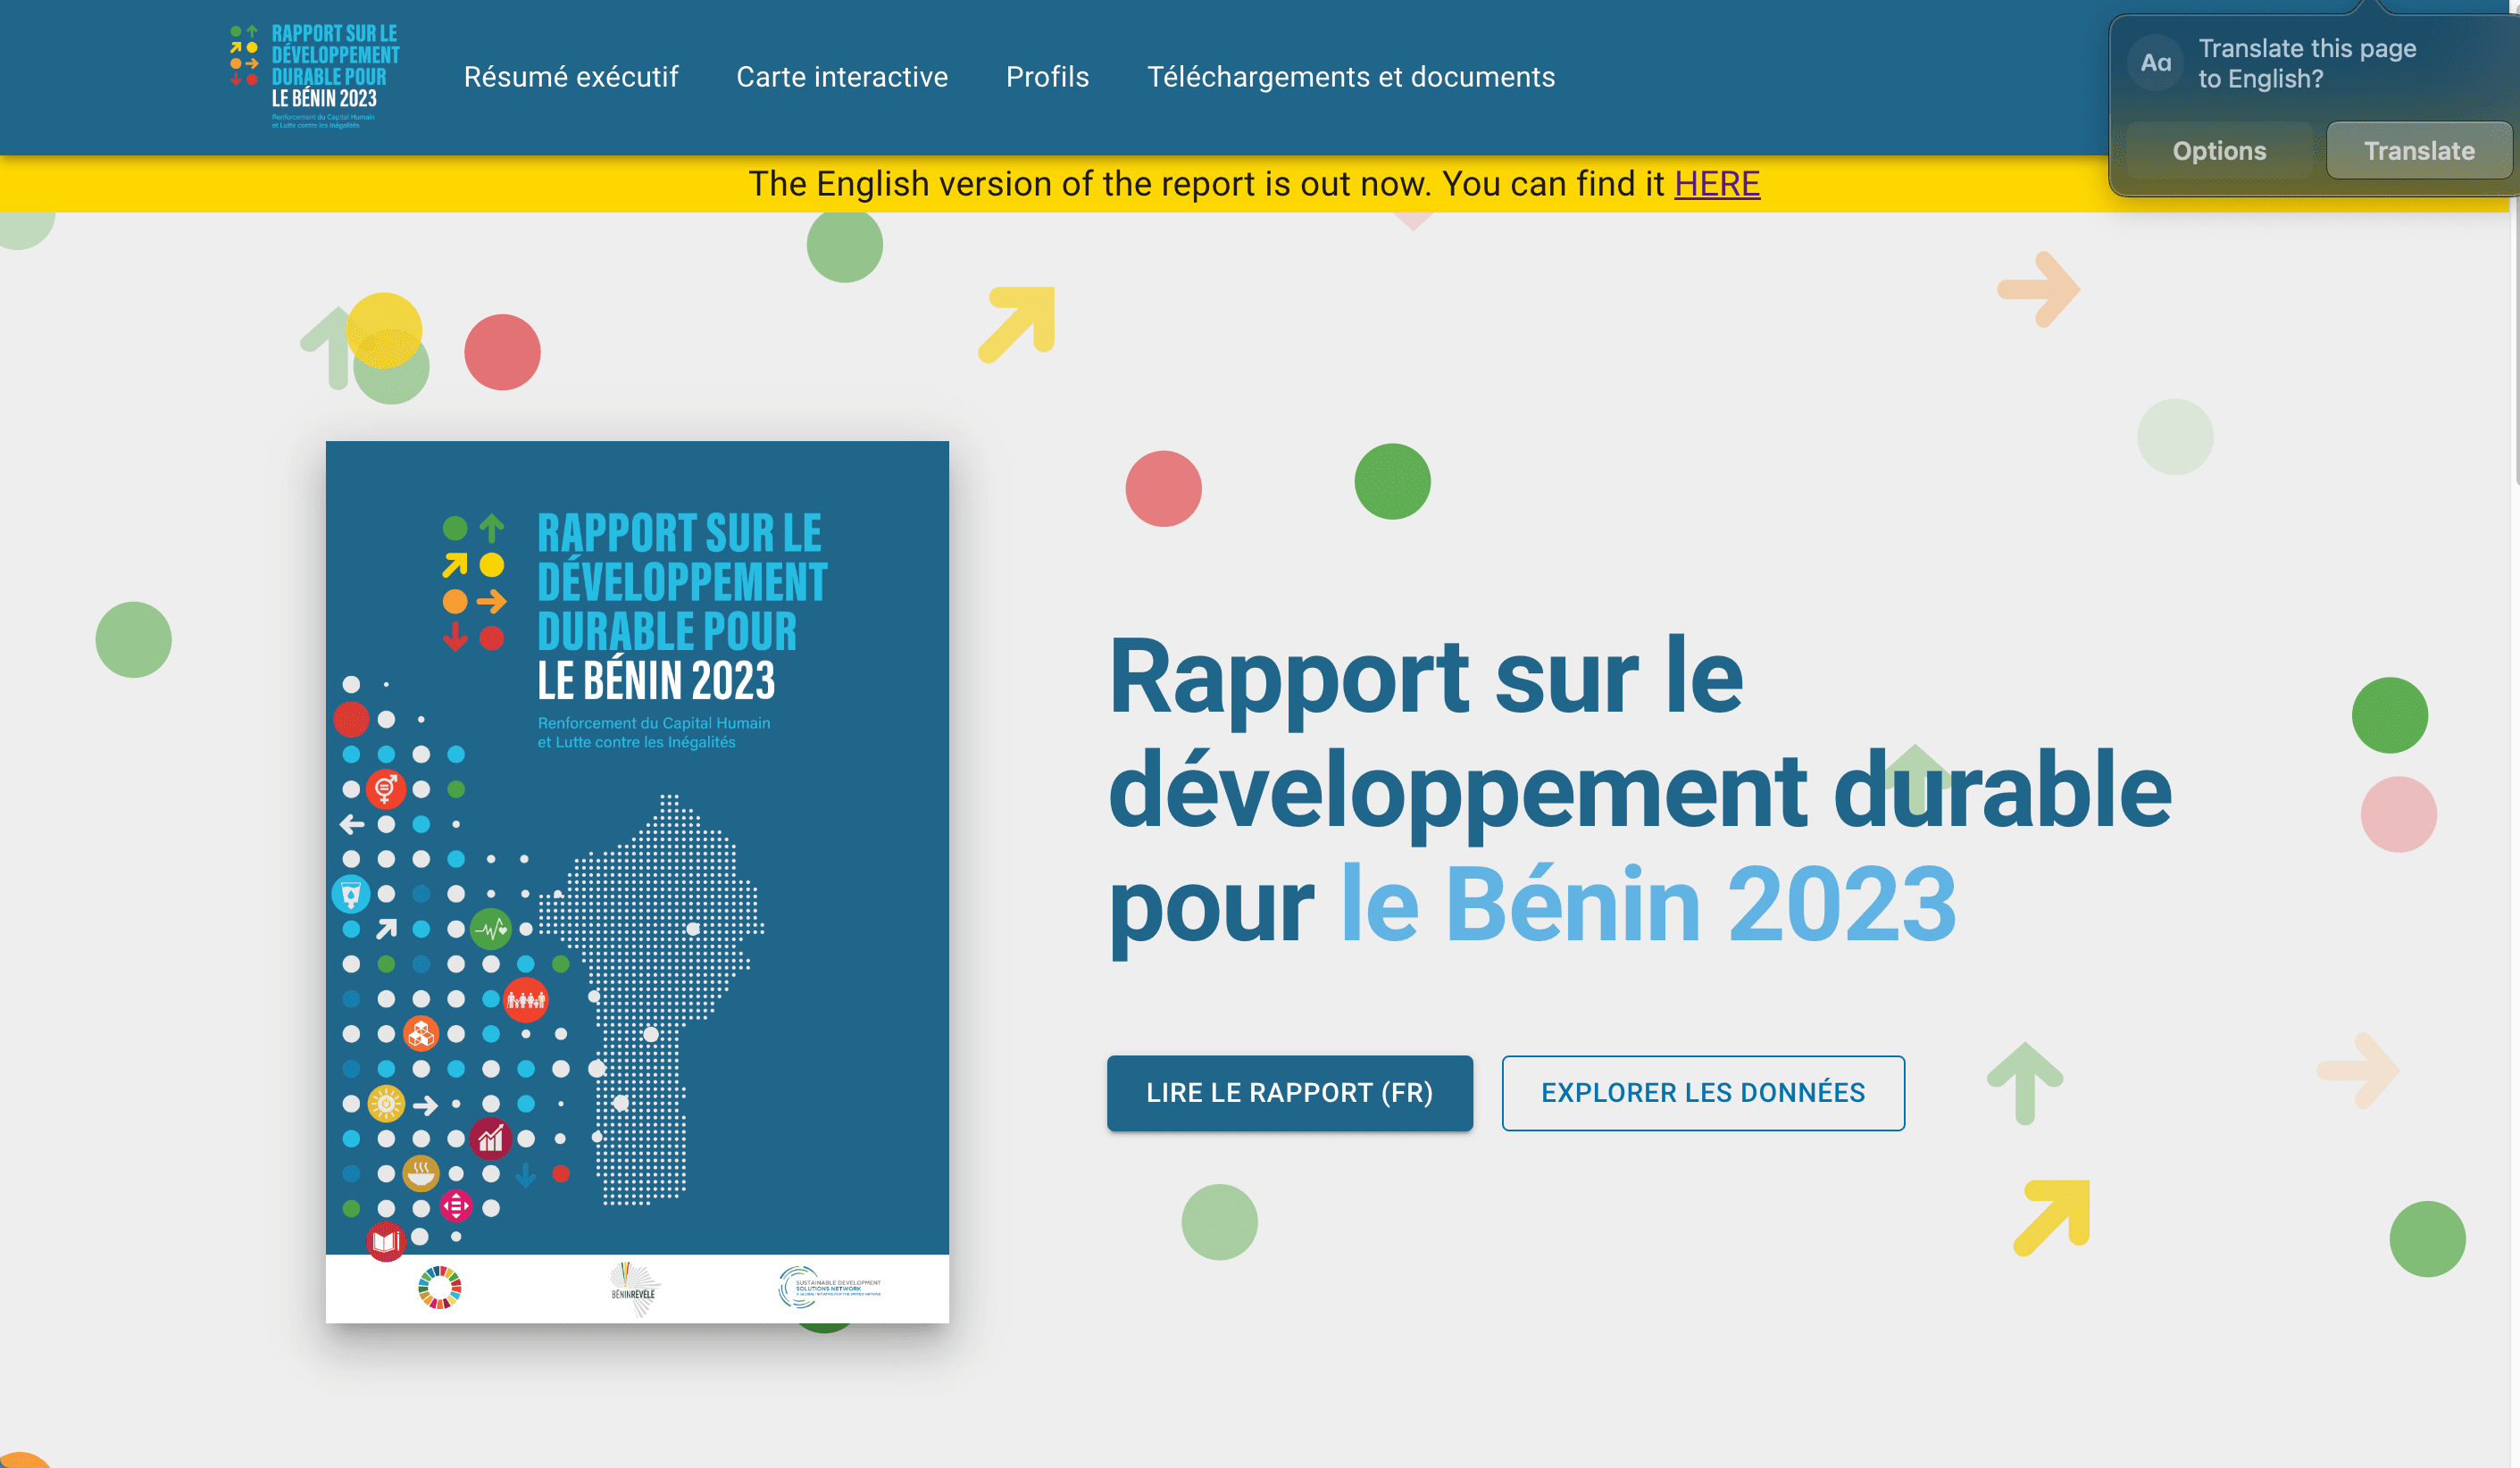
A data visualization tracking performance of Benin towards the Leave-No-One-Behind indicators.
A community of guitar enthusiasts to share their passion for music.
Javascript game to change as many diapers as you can!

Generating a supply chain analysis with automation capabilities
Generating a return on R&D investment analysis, along with a self-generated report as an output
Development of best practices for data analyses and data visualizations in the US Northeast region
Development of an automated tool to self-generate tables for reports